The problem
We have access to purchase data of customers. We’d now like to construct buyer personas from them, so that we can understand our customers, & target them better.
We can accomplish this via cluster analysis of this spend data to figure out the buyer patterns. This is a brief illustration of the process.
It must be noted that rarely is this process straight-forward, as it involves tinkering with:
- Clustering algorithms (hierarchical or kmeans);
- Linkage measures (single, complete, average);
among other things, & multiple back-and_forths with the marketing/sales teams to see if the results generated from each iteration mimic reality.
As always the output of analytics should not be accepted as gospel, but as yet another data point to be included in business discussions.
What was the customer spend for each service line?
This is spend/purchase data for 45 customers over 3 service lines (bronze, silver & gold levels), calculated over 1 year.
What was the overall spend for each service line?
How many customer segments do we have?
Two customer segments are identified from cluster analysis of the spend data.
What is the purchase behavior of these customer segments?
Here, we see that the customers are split along two segments with one segment (the premium one) preferring the gold level of service, over lesser service levels, & another segment showing the exact opposite preference.
Appendix: Kmeans Clustering - Elbow plot
Here, we get optimal # of clusters as 2, from visual inspection of above elbow plot.
Appendix: Kmeans Clustering - Silhouette Plot
Here, we get optimal number of clusters as 3, from visual inspection of silhouette plot
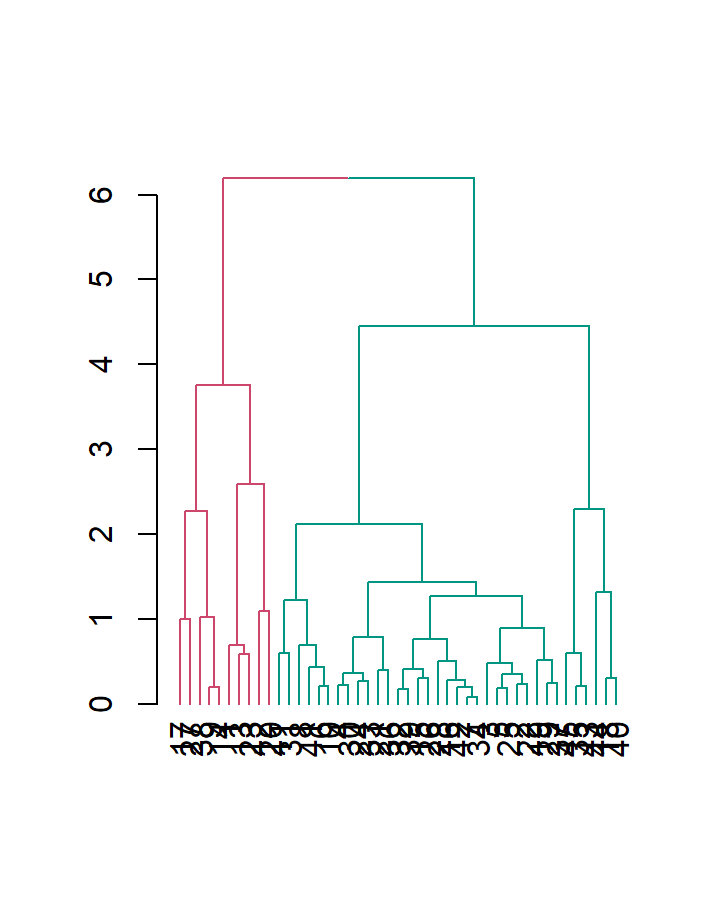
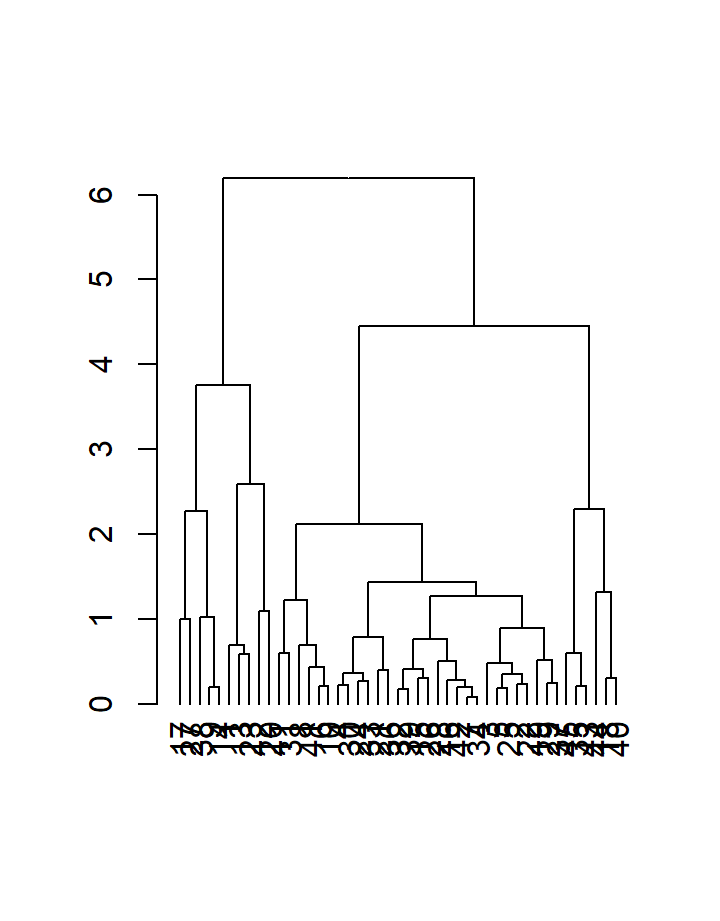
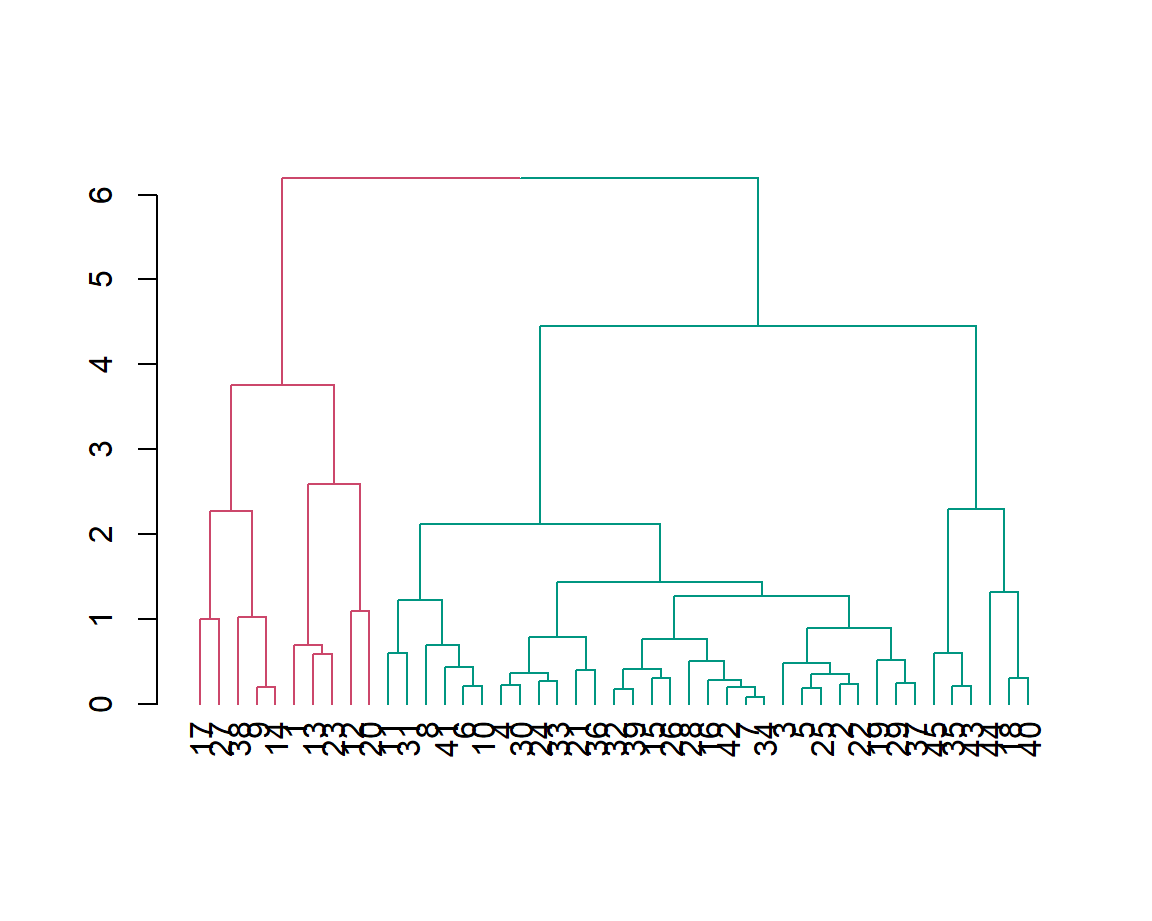
Appendix: Hierarchical clustering - Dendrogram
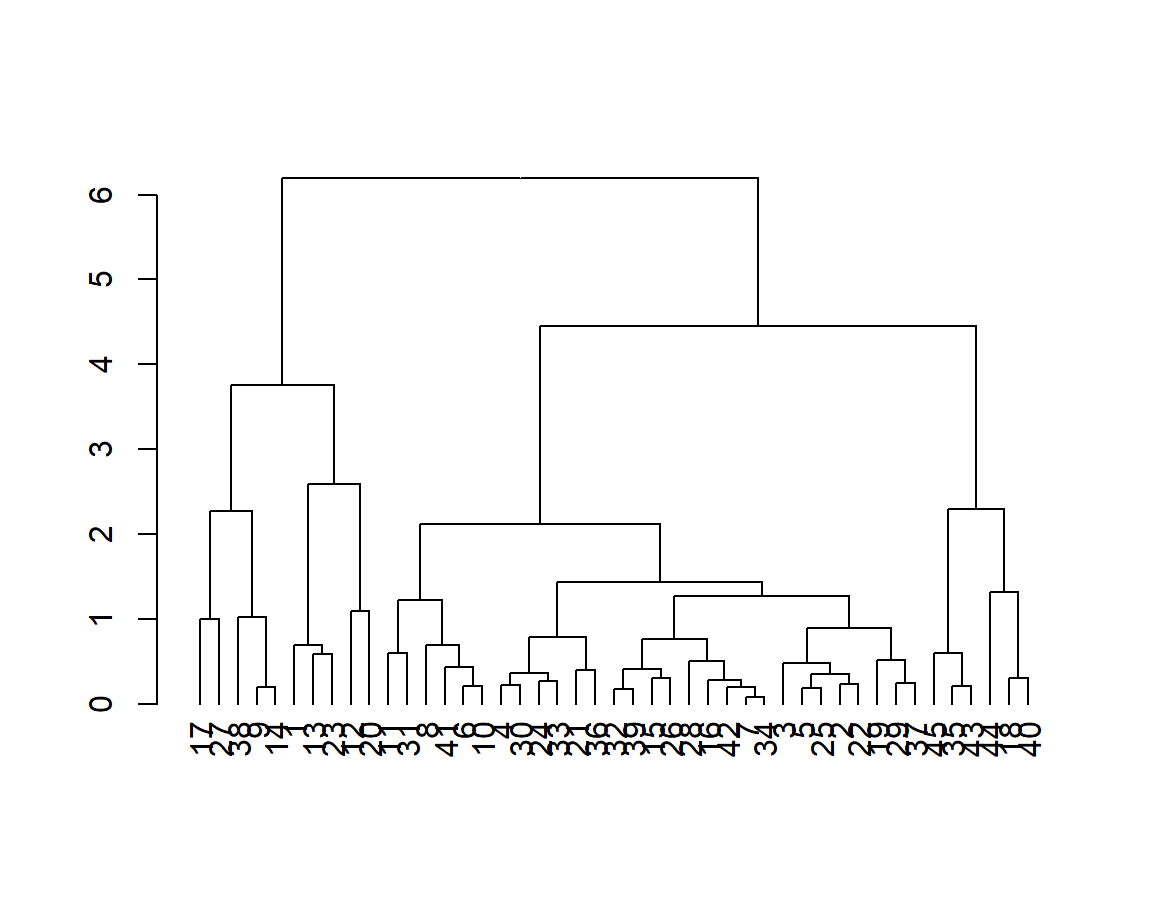
Here, we get the optimal number of clusters as 2, from visual inspection of the dendrogram.
Ultimately, we settle on 2 as the ideal number of clusters, via majority vote.