The problem
Assume we’ve performed customer segmentation, & now want to launch a new product/service, catered to appeal to a particular segment(s). But, we need guidance on which features to include in our offering. We therefore roll out a survey in an attempt to get some data points in this regard
Performing a Conjoint Analysis on the survey data will give us an idea of how potential customers value each feature or combination of features, in terms of their Willingness To Pay (WTP). This is a simple illustration of this process using multi-nomial logistic regression, although other methods are also possible.
This exercise is very useful for most companies, as it gives them a good base for discussions with the development/operations team, & the marketing team, as to which features to include in the product, while trading off costs of including each feature, with the associated WTP of said feature.
Despite its ubiquity, the results of conjoint analysis should always be taken with a bit of skepticism, as they typically tend to over-state the WTP figures, as it’s hard to simulate an actual buying situation for the customer through an online survey. Nevertheless, they’re still used because their usefulness of stimulating vigorous cross-functional discussion tends to outweigh such disadvantages.
Survey responses
We collected 6000 data points by surveying 200 respondents, & individually showing them 30 product profiles based on combinations of the following service attributes:
- Service level (bronze, silver, gold);
- Ability to reserve service in advance (yes, no);
- Use of more expensive but environmentally friendly chemicals (yes, no); &
- Price (30, 35, 40)
How do they rank the product’s features & what is their WTP?
Here, a model is generated by using multi-nomial logistiic regression of the survey data. The complexity of the process is hidden here, as typically it involves selection of the best model from a set of multiple candidate models.
We get a ranking of each product/service feature in terms of the customer/respondents willingness to pay (WTP).
Here, we see that the ability to reserve a service in advance garners the highest WTP from the customer, followed by gold-level service. Interestingly, we see that using environmentally friendly chemicals hardly moves the needle in terms of WTP for our consumers.
Hypothetical market scenario
Using the model that we’ve generated, we can construct a hypothetical basket of products, consisting of our chosen offering, & a competitor’s offering, & see how they would do in the market.
In our scenario, the competitor’s offering differs from us with regard to being cheaper, not having the ability to reserve the service in advance, & a lower level of service (silver as opposed to gold).
In practice, this portion of the analysis tends to be useful as it’s a great discussion prompt. Besides our product, we typically fill the basket with 2-3 top competing products (although we have illustrated only one here) & model what happens. We can also take this even further by modeling the likely competitor’s response to our our product launch & see what might happen there as well.
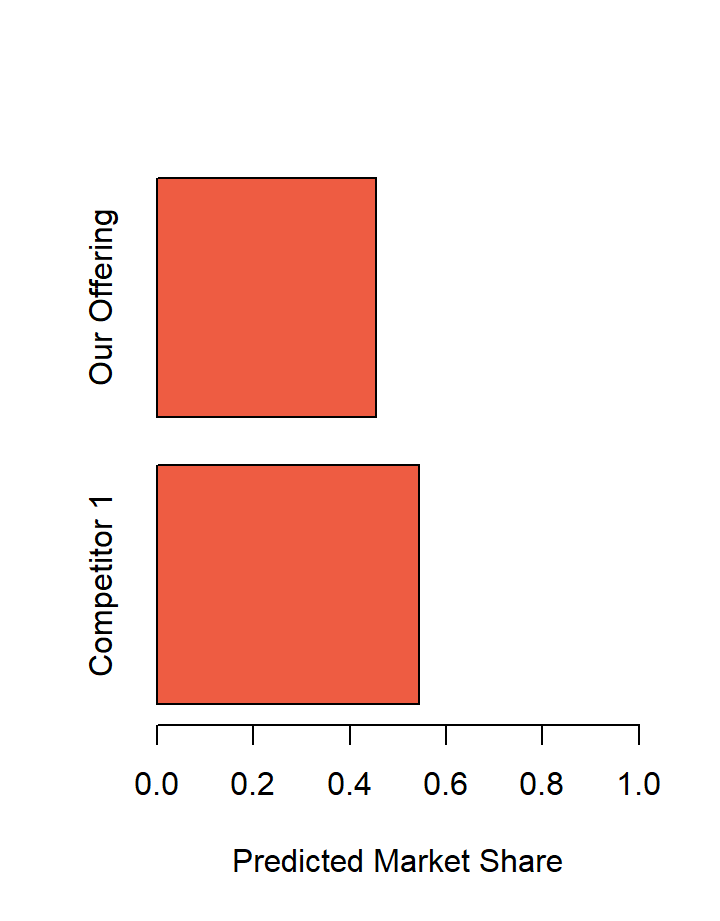
How would our product do in the market?
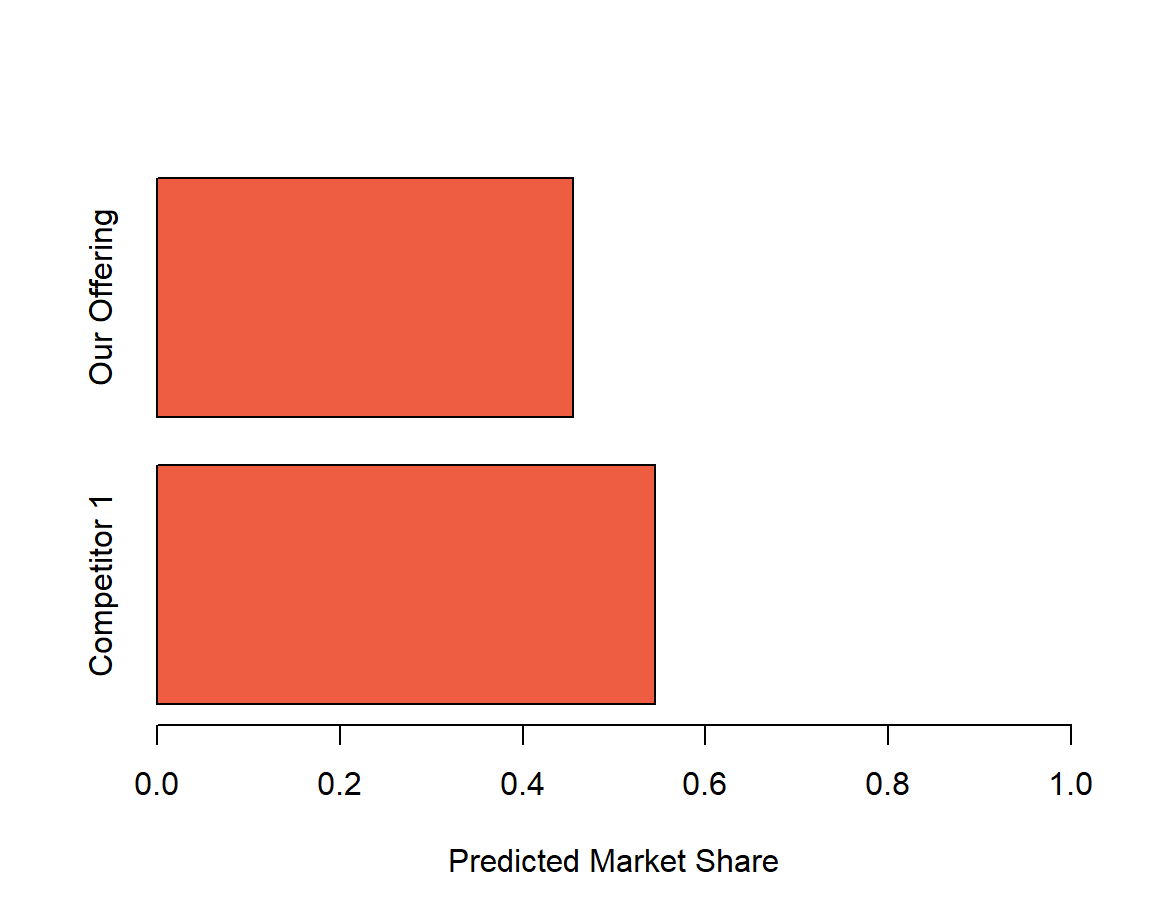
We see that we’ll have to go back & refine our service offering, as our service seems to be trailing that of our competitor’s offering (46% market share as opposed to 54%).